




Featured case study, home services
$63.5K in ad spend. $1.36M in tracked revenue.
A high-ticket home services company was spending on marketing and getting leads, but nobody could say which dollar produced which job. We built the tracking, ran the channels, and tied every sale back to its source.
Client name withheld. Results cover February through April 2026 unless noted.
21.3x
Google Ads return, February to April
12.2x to 24.6x
same-month return, February to April
4.3%
marketing cost of sale, February to May
$3.5M
closed revenue company-wide across 97 won deals
What we built
Running ads was the smaller part of the job. We built the system that shows what the ads produce.
- Full-funnel attribution. Every call, form, text, and email tracked from first touch to booked appointment to closed revenue.
- Multi-channel lead engine. Google paid search, Local Services Ads, Bing, Meta, SEO, and lead aggregators, managed against cost per sold job instead of cost per click.
- Intake and speed-to-lead. Lead routing, follow-up automation, and overflow call coverage so fewer calls go unanswered.
- One sales pipeline. The sales team sees every call, text, email, and customer interaction in one place.
- Revenue reporting. Live dashboards that connect spend to appointments to sold revenue, by channel and by month.
The results
| Month | Closed revenue from our channels | Spend | Return |
|---|---|---|---|
| February 2026 | $402K | $33K | 12.2x |
| March 2026 | $1.12M | $52K | 21.4x |
| April 2026 | $879K | $36K | 24.6x |
| All three months | $2.40M | $121K | 19.8x |
Revenue is counted in the month the job sold. Return is closed revenue divided by spend for the same period.
- Google Ads, February to April: $63,532 in spend produced 115 net issued appointments, 34 sales, and $1,355,874 in closed revenue. That is a 21.3x return.
- Marketing cost of sale, February to May: 4.3% across every channel we managed, against an industry norm of 8 to 15% for high-ticket home services. That works out to $406 per appointment, $1,581 per sold job, and a $36,346 average job.
- Company-wide, February to April: $3.5M in closed revenue across 97 won deals from every lead source. The channels we managed brought in 68% of that revenue and 66 of the 97 deals.
- Sales against the company’s own targets, as reported by the client: 20 against a target of 20 in February, 46 against 28 in March, and 31 against 24 in April.
Why the return kept climbing
The monthly return went from 12.2x to 24.6x while April spend came down. Every closed job showed us which channels, campaigns, and keywords produced profitable projects, and the next dollar went where the last one had proved it should.
By May, demand was no longer what limited the company’s growth. Production capacity was, so we pulled spend back.
The longer view
Twenty months on one account
Those three months sit inside a longer engagement. For twenty months we ran this company’s whole marketing and measurement function: paid search, paid social, lead aggregators, analytics, CRM, automation, conversion tracking, and the phone system. We logged 135 milestones as they happened, each with its source.
The largest group was not something we built. It was 42 things we found already broken that nobody could see. Tracking numbers switched off. A consent field hardcoded to the wrong value. A bot filter set one notch too tight. Each result below started with finding one of those.
Six problems and what each one was worth
Phone reachability
Pieces of the call tracking setup had been switched off or mislabeled without anyone noticing. Calls still connected. The tracking behind them did not.
Result: All 112 tracking numbers now carry the company’s caller ID record, up from 31 of 112. It took ten months and an independent audit.
CRM data integrity
A new call-to-CRM automation started creating duplicate deals, affecting more than 200 leads. Vendor support had no fix, so we brought in an outside specialist.
Result: New duplicates stopped three weeks after the first report. Two steps in one automation were each creating a record.
Form volume and bot filtering
A spam flood led to bot filtering on the lead form. Later we found the filter set one notch too tight. Weekly form submissions had dropped from 98 to 18.
Result: Weekly volume back to 98, appointments up 19%, and cost per lead down from $116 to $104 through a 58% spend cut and re-ramp.
Lead follow-up
We audited 843 website form deals against the contact records to see what happened after each lead came in.
Result: $106,000 to $134,000 in revenue identified as recoverable, plus 42 qualified leads that were still open and had never been contacted.
Channel expansion
Five new lead channels opened in nine weeks. Then we measured each one against the rest.
Result: One channel had 49% of its budget on its weakest performer. Paid social booked at 29.6% against a 20.4% company rate, and a test campaign costing $599.89 per appointment was retired.
Build versus buy
Three times in eighteen months someone pitched replacing the marketing stack. Each time we tested the pitch against the specific jobs the replacement would have to do.
Result: Stack kept all three times. The gaps the pitches pointed to were built in-house instead.
Figures come from the client’s own CRM, call tracking, and ad platform records.
Want to know what your marketing produces, down to the sold job?
Paid search, 2018 to 2020
Over 150% ROI


What we did
- Full-spectrum PPC campaign
- Ad copy
- Landing page design
- Call flow
- E-commerce checkout
- Full analytics setup
We managed over $450,000 in Google Ads spend in 2019.
SEO, 2018
300% organic traffic growth


We ran a six-month SEO project with Follain starting in July 2018. By the end of the project, organic traffic had more than tripled.
What we did
- Technical SEO
- Local SEO campaign
- On-page content updates
The project gave us working knowledge of the clean beauty market that carries over to clean shopping more broadly.
SEO, 2017 to 2018
175% organic traffic growth

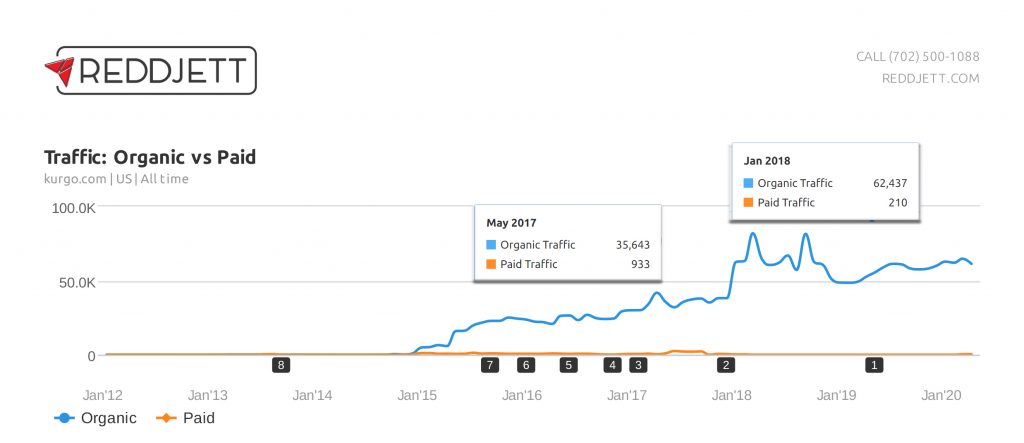
We ran an SEO project with Kurgo starting in May 2017. Organic traffic grew more than 175% by January 2018.
What we did
- Blogger outreach
- Infographic outreach
- Technical SEO
- On-page content updates
App marketing
Over 100,000 registrations in the first year

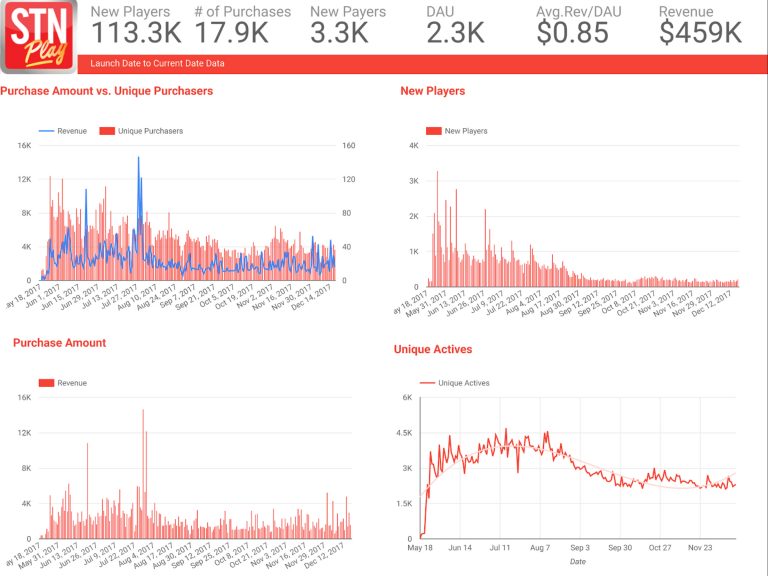
As Director of Social Gaming at Station Casinos, our founder led a social gaming launch that produced over 100,000 registrations, 2,300 daily active users, and over $500,000 in revenue in its first year of operation.
What the campaign covered
- App install campaigns through Facebook Ads, Chartboost, AdRoll, and email
- App Store Optimization (ASO) for iOS and Android
- Budget allocation
- Customer retention
Link building and local SEO, 2019 to 2020
Vegas Party People

We launched Vegas Party People as a lead generation site for two verticals: transportation and nightlife. Services include VIP party buses, limo rentals, and bottle service at top nightclubs. We later added dining, pool parties, and shopping tours.

Organic traffic
We started with local SEO and began link outreach in June 2019. Growth since then has been strong. November and December are slow months in Las Vegas because of the holidays.
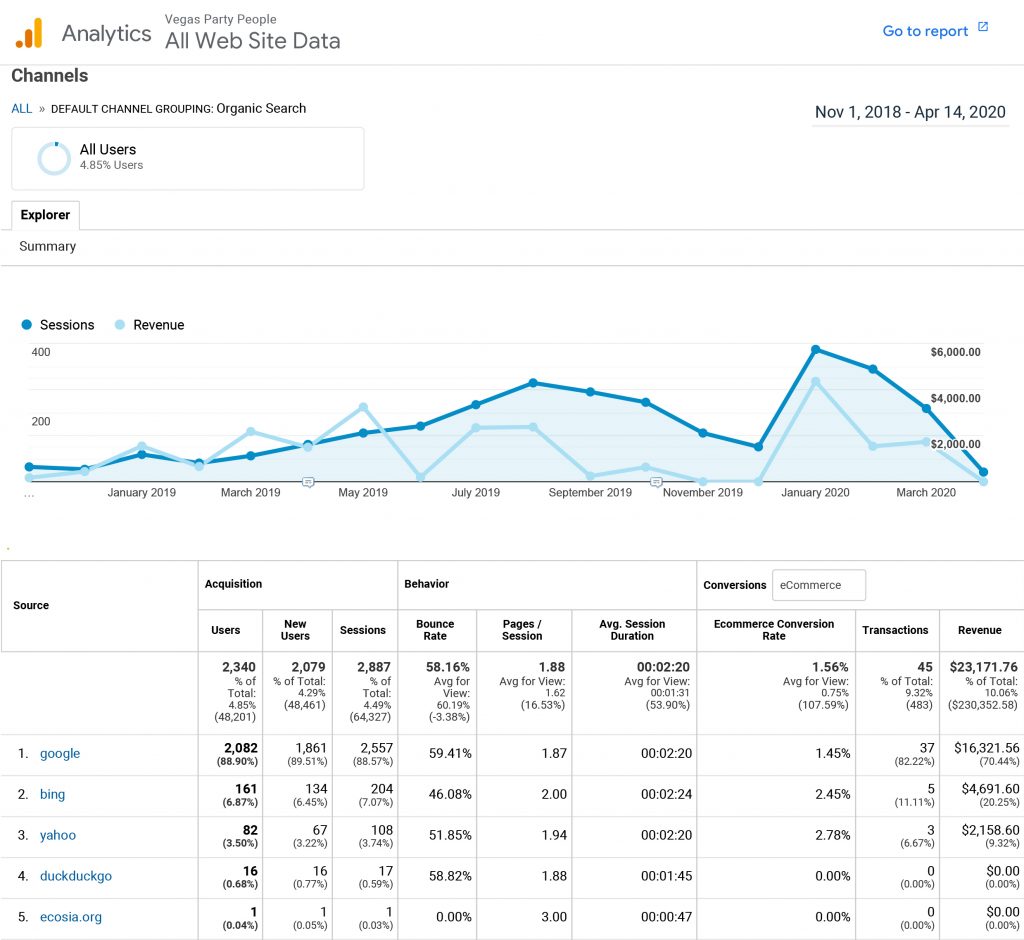
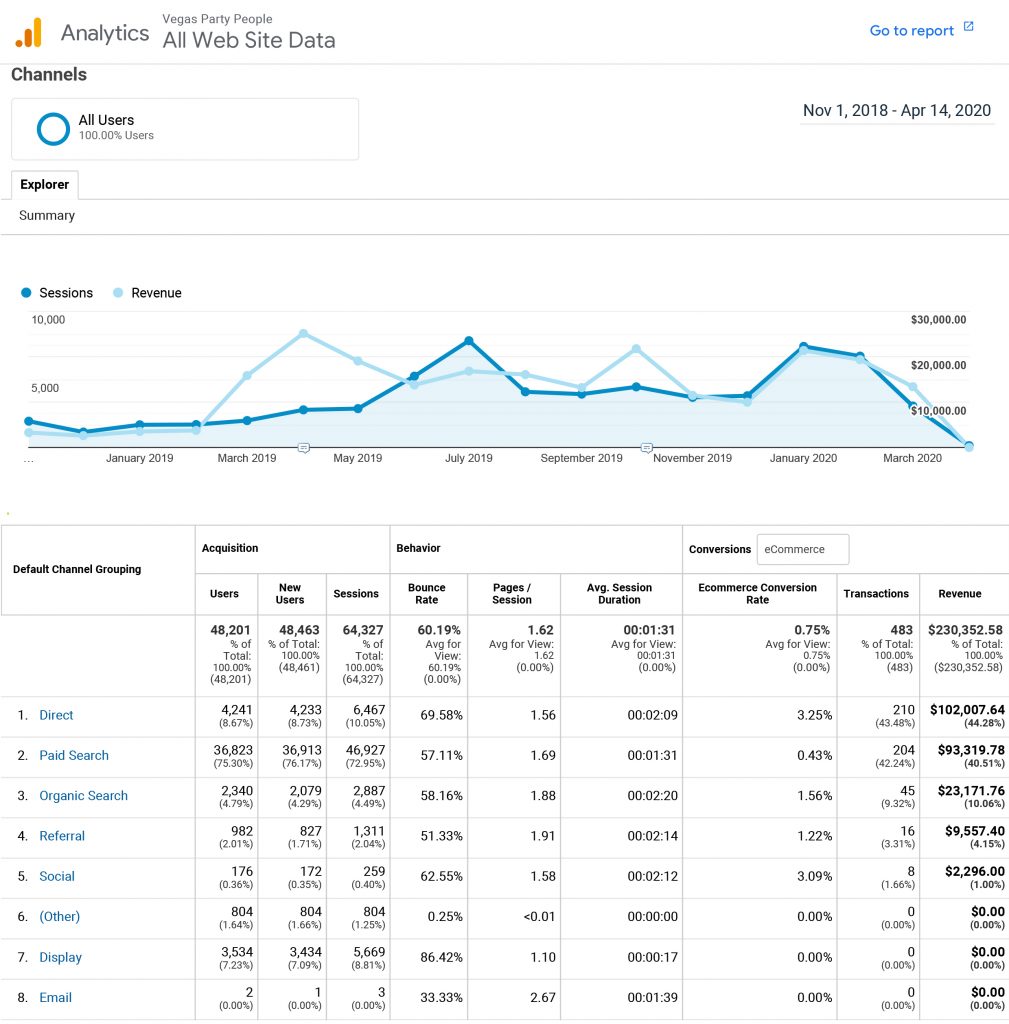
The multi-channel campaign brought in over $230,000 in gross sales as of spring 2020.
THE OPPORTUNITY
Growing Your Business Profitably
We’ve worked with some of the largest agencies specializing in Enterprise Paid, SEO, and App Marketing.
Unfortunately, most of these enterprise agencies will do just enough to keep you spending, focusing on poor metrics that are not correlated to business objectives (making a profit).
As a lean and focused agency, we partner with clients positioned for explosive growth. We only recommend growth channels we know make sense from a Cost Per Acquisition & Cost Per Install perspective.
Let’s Work Together to Launch Your Company to the Top of Your Niche
SERVICES
Pay Per Click Marketing
$1500
per month
- World Class PPC Campaign Setup
- PLA Setup & Optimization
- Maximized Extensions
- Constant Test for Optimized Ad Copy
- Complete Analytics Integration
SEO Essentials
$2,500
per month
- Technical On-Site SEO
- Site Speed Audit & Recommendations
- Content Optimization up to 2 (existing) articles per month (Titles, Description, Keyword Analysis, Image GeoTagging)
- Assist with Content Strategy & Roadmap
- Manual White Hat Backlink Outreach
- 1 Ultra Premium Guest Post per month DR 30-50
- Up to 5 placements per month on sites with real organic traffic DR 20+
- Anchor Text Evaluation & Recommendations
- Premium Toolset Integration: SEMRush, Ahrefs, GSC, Data Studio, Google Analytics
- Rank Tracking 100 Keywords X 1 Geo
Ecommerce Web Design
$1000
per month*
- Super Fast Optimized E-commerce Website
- Dedicated Hosting
- CDN
- SEO Optimized
- Easily Add New Products
- Easily Create New Content to Showcase Products


ABOUT US
Our Founder, Benjamin Barber, served as SEO Manager at Station Casinos LLC from Oct 2014 until Oct 2015. Organic traffic improved over 50% during this time resulting in promotion to Director of Interactive Marketing where he oversaw all aspects of the company’s online presence until 2018.
Since then, 100% of his efforts have been to expand our clients’ traffic and revenue through the most profitable online channels.
